Download Profile

Data-Driven Insights with Power BI Reports Services in USA

At Epik Funnel, a trusted analytics and digital solutions agency in the USA, we deliver advanced Power BI Reports services that transform raw data into interactive dashboards and actionable insights. Our reports empower businesses to make faster, smarter, data-backed decisions.

Power BI Reports and Dashboards
Visualize Your Data

Custom Power BI Dashboards for Smarter Decisions

Our Power BI Reports Services in the USA help organizations convert complex datasets into clear, interactive dashboards that reveal trends, KPIs, and performance metrics in real time. Instead of static spreadsheets, we deliver dynamic reports that support strategic decision-making.

Our services include Power BI data modeling, ETL integration, custom report design, DAX calculations, real-time data connections, and secure sharing. Whether you need executive dashboards, sales analytics, or financial reporting, we create scalable Power BI solutions that align with your business goals.

Request a Quote

Why Epik Funnel for Power BI Reports Services in USA

Choosing the right Power BI reporting partner in the USA is essential for turning complex data into actionable business insights. Epik Funnel helps US organizations make faster and smarter decisions through advanced Power BI reporting.

Interactive Data Visualization

We design interactive Power BI dashboards that transform raw data into clear visuals, enabling US businesses to monitor performance, trends, and KPIs in real time.

Certified Power BI Experts

Our team of Power BI specialists brings deep experience in data modeling, DAX, and report optimization to deliver reliable insights tailored for US business environments.

Customized Reporting Solutions

We build custom Power BI reports aligned with your business goals, data sources, and compliance needs, ensuring every insight supports decision making across US operations.

Transparent Insights and Support

Epik Funnel ensures clear reporting processes, ongoing support, and knowledge transfer, giving US teams confidence and control over their Power BI reporting systems.

Google Partner
Meta Partner
HubSpot Partner
Shopify Partner
Salesforce Partner
SEMrush Partner
Mailchimp Partner
Moz Partner
Google Partner
Meta Partner
HubSpot Partner
Shopify Partner
Salesforce Partner
SEMrush Partner
Mailchimp Partner
Moz Partner

Our Specialized Services

Visualize your data like never before with Epik Funnel’s Power BI reporting solutions. We turn complex analytics into clear insights through automated dashboards, seamless integrations, and smart data visualizations.

Data Analytics Setup

Configure Power BI analytics that transform raw data into visual insights and actionable intelligence for faster decisions.

Visit Service β†’

Data Integration

Connect Power BI with CRMs, marketing tools, and databases for a unified view of your performance metrics.

Visit Service β†’

Performance Dashboards

Design real-time Power BI dashboards that visualize KPIs, ROI, and marketing performance across every channel.

Visit Service β†’

Platform Analytics

Unify multi-channel data into Power BI for deeper analytics on user trends, engagement, and traffic flow.

Visit Service β†’

Project Planning Insights

Build Power BI reports that analyze project milestones, timelines, and resource utilization for smarter planning.

Visit Service β†’

Content Strategy Reports

Combine content performance metrics in Power BI to identify top strategies, formats, and engagement trends.

Visit Service β†’

Automation Integration

Automate Power BI data refreshes and reporting pipelines with seamless integration into marketing ecosystems.

Visit Service β†’

Performance Optimization

Enhance report loading speeds and visualization performance for a smoother Power BI experience.

Visit Service β†’

User Journey Reports

Visualize customer journeys and conversion paths with Power BI funnel and behavior tracking reports.

Visit Service β†’

Conversion Optimization

Use Power BI to identify drop-off points, test results, and ROI from CRO experiments across campaigns.

Visit Service β†’

Goal Tracking Dashboards

Develop Power BI dashboards that track revenue, conversions, and business goals in real time.

Visit Service β†’

A/B Testing Reports

Analyze performance data from A/B tests in Power BI to pinpoint high-performing ads and landing pages.

Visit Service β†’

Performance Metrics

Monitor campaign trends, sales impact, and engagement levels with dynamically updated Power BI visuals.

Visit Service β†’

Trend Monitoring

Identify real-time marketing trends and visualize performance patterns using Power BI predictive analytics.

Visit Service β†’

Data Visualization Design

Craft interactive visuals and charts in Power BI that communicate your marketing success at a glance.

Visit Service β†’

Digital Strategy Reporting

Transform your marketing strategies into measurable Power BI reports that reveal long-term performance growth.

Visit Service β†’

Transform Your Business Insights with Power BI

Visualize Your Data Clearly

Epik Funnel helps US businesses create interactive Power BI dashboards that turn raw data into visually compelling reports. Make faster, data-driven decisions with clear insights at your fingertips.

Power BI Data Visualization

Actionable Insights & Reporting

Our Power BI reports provide US businesses with actionable insights by analyzing trends, KPIs, and performance metrics. Make confident decisions with reports that simplify complex data.

Power BI Insights Reports

Optimize Cost Efficiency

Epik Funnel helps US businesses maximize ROI by using Power BI to identify cost-saving opportunities, eliminate inefficiencies, and monitor budget performance with precise reporting.

Power BI Cost Efficiency

Advanced Analytics & Insights

Leverage the power of Power BI to combine multiple data sources, perform predictive analytics, and uncover actionable insights. Epik Funnel enables US businesses to make smarter, informed decisions.

Power BI Advanced Analytics

Track ROI and Performance

Epik Funnel enables US businesses to measure campaign ROI, monitor sales impact, and evaluate business performance through customized Power BI dashboards, ensuring investments deliver measurable results.

Power BI ROI Tracking

Manage Dashboards Efficiently

Epik Funnel manages your Power BI dashboards end-to-end for US businesses. From scheduled refreshes to user access control and visualization updates, we ensure your reporting environment is always accurate and actionable.

Power BI Dashboard Management

Meet Our Esteemed Partners

We collaborate with industry leaders and innovative companies to deliver exceptional value and expand our global reach. Our partnerships are built on mutual trust and a shared vision for success.

Case Study with Brands

We’re proud to partner with businesses of all sizes, helping them achieve remarkable insights and data-driven growth.

Our Latest Blog Section

Driving Real Digital Success

Our commitment to excellence translates into tangible results and a growing global footprint.

Our Digital Footprint

1.5K+
Facebook Followers
900+
Instagram Followers
500+
TikTok Engagements
300+
YouTube Subscribers
600+
LinkedIn Connections
200+
Twitter Followers
50+
Satisfied Clients
$5000+
Client Revenue Generated
5%+
Average Growth Achieved
5+
Industry Awards Won
88%
Client Retention Rate
25+
US States Served

Client Success Highlights

75+
Satisfied Clients
$5000+
Client Revenue Generated
25%+
Average Growth Achieved
5+
Industry Awards Won
88%
Client Retention Rate
25+
US States Served

Our Certifications

Google Partner Epik Funnel

Google Partner

American Marketing Association Mamber

AMA Member

Hubspot

HubSpot Partner

Meta Certified

Meta Certified

Google Analytics Partner

GA Partner

Shopify Partner

Shopify Partner

Meet Our Visionary Leader

Learn about the driving force behind Epik Funnel and the core principles that guide our journey towards digital excellence.

CEO Name

Muhammad Azeem

Founder & CEO, Epik Funnel

“Welcome to Epik Funnel! It’s an honor to lead a team so dedicated to innovation and client success in the ever-evolving world of digital marketing. We founded this agency with a simple yet profound goal: to empower businesses, big and small, to unlock their full online potential. Every strategy we develop, every campaign we launch, is rooted in deep analysis, creative thinking, and a genuine commitment to delivering measurable results. We don’t just aim for traffic; we aim for impact. Thank you for considering us as your partner in growth.”

A Message from Our CEO

“Welcome to Epik Funnel! It’s an honor to lead a team so dedicated to innovation and client success in the ever-evolving world of digital marketing. We founded this agency with a simple yet profound goal: to empower businesses, big and small, to unlock their full online potential. Every strategy we develop, every campaign we launch, is rooted in deep analysis, creative thinking, and a genuine commitment to delivering measurable results. We don’t just aim for traffic; we aim for impact. Thank you for considering us as your partner in growth.”

– Muhammad Azeem

Our Vision

To be the leading force in digital marketing, recognized globally for our innovative strategies, unwavering commitment to client success, and our ethical approach to transforming online presences. We envision a future where every business, regardless of size, can harness the power of digital to connect, engage, and thrive.

  • To set new benchmarks in digital marketing effectiveness.
  • To cultivate a global community of empowered and successful businesses.
  • To continuously innovate and adapt to the digital landscape.
  • To foster a culture of excellence, integrity, and continuous learning.

Our Mission

Our mission is to empower businesses by providing cutting-edge, data-driven digital marketing solutions that deliver tangible growth and measurable ROI. We achieve this by:

  • Strategizing with Precision: Developing customized strategies based on in-depth market analysis.
  • Executing with Excellence: Implementing campaigns with creativity, precision, and the latest technologies.
  • Building Lasting Partnerships: Fostering transparent, collaborative relationships with our clients.
  • Driving Measurable Results: Focusing on KPIs that directly impact our clients’ bottom line.

Make Faster Decisions with Power BI Reports Services in USA Built for Clear Growth Insights

We are Epik Funnel USA, and we help teams turn scattered data into simple dashboards that support better marketing and business decisions. Our Power BI Reports Services in USA help you connect marketing analytics, sales reporting, and performance tracking into one clear view, so you can see what works, what needs fixing, and where to focus next.

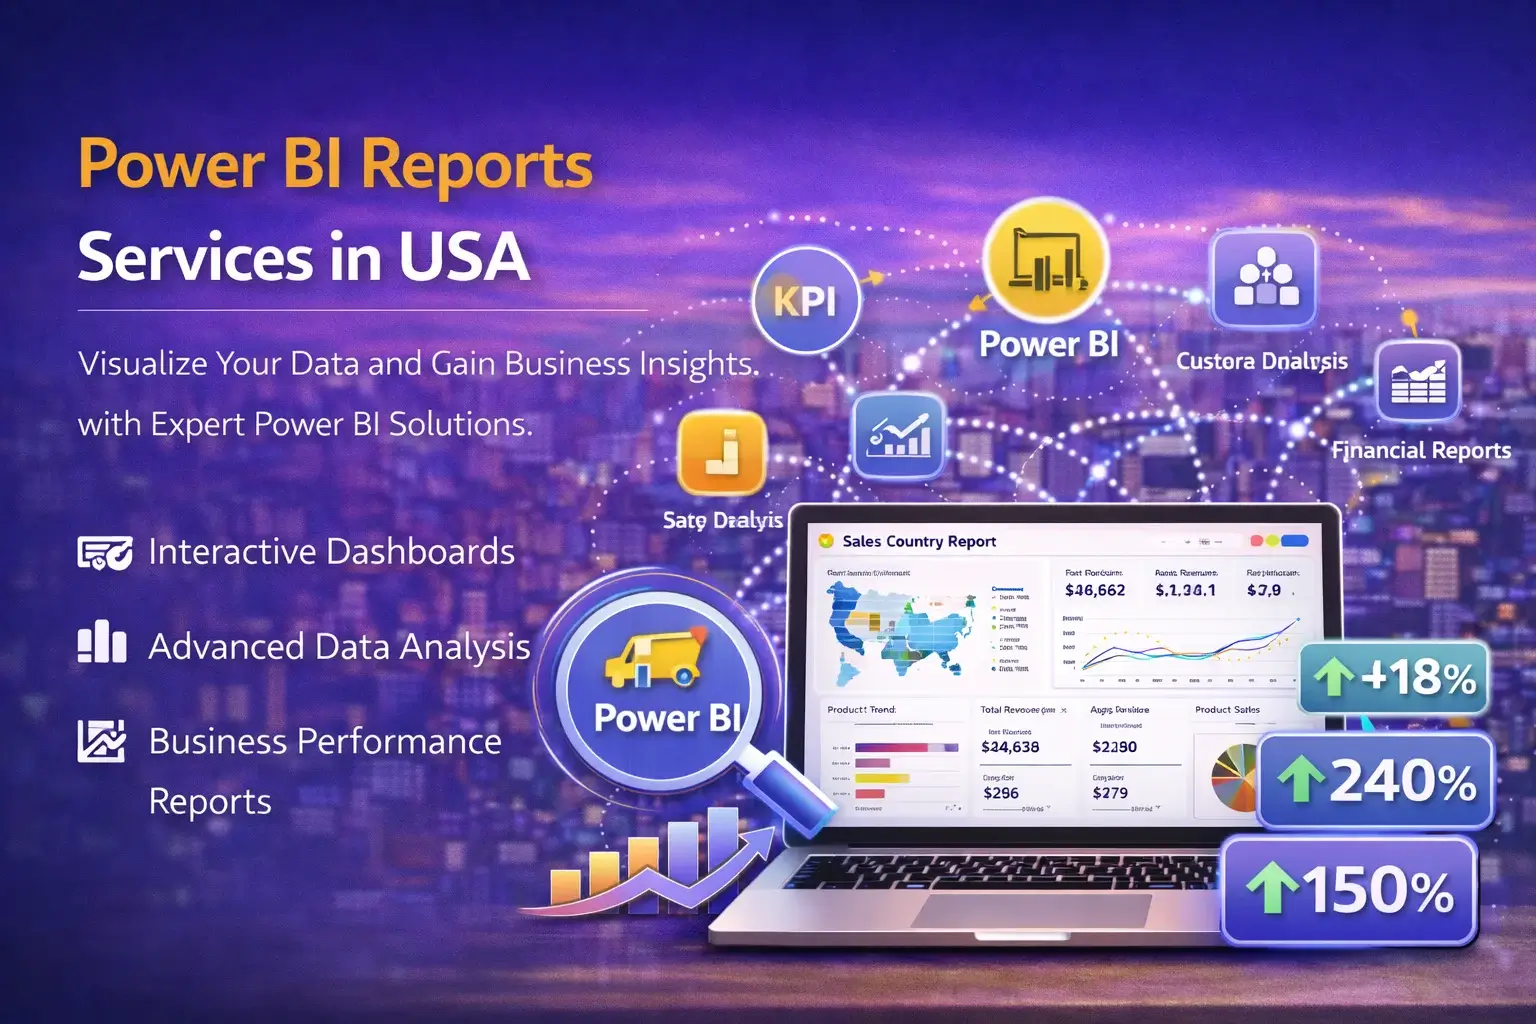
We Build Power BI Dashboards That Show the Metrics You Actually Need to Improve Performance

When reports are confusing, teams waste time arguing about numbers instead of improving results. We solve that by creating clear Power BI reports, organized data models, and easy-to-read interactive dashboards that give your team one source of truth. We focus on what matters for digital growth, including lead generation performance, campaign ROI, conversion rates, and pipeline health. With Epik Funnel USA, you get reporting that feels simple enough for anyone to use, but strong enough for leadership decisions.

What Power BI Reporting Is and Why It Matters for Digital Marketing and Growth Teams

Power BI reporting is the process of turning raw data into visual dashboards that help you understand performance quickly. Instead of reading spreadsheets or exporting data from multiple tools, you can see your results in one place. Power BI can connect data from ad platforms, websites, CRMs, and ecommerce systems, then present it as clean charts and tables. This helps marketing teams track cost per lead, return on ad spend, conversion performance, and lead quality, while helping leadership understand growth trends at a high level. Our work is built for organizations in the USA that want clear decisions and better reporting control.

Power BI Terminology Explained: Dashboards, DAX, Data Model, and Clear Metrics

Power BI has a few common terms that can sound technical, but they are easy to understand. A dashboard is a visual screen showing key metrics. A report includes multiple pages of visuals. A dataset is your data source after it is shaped and prepared. A data model is how tables connect so metrics calculate correctly. DAX is a formula language used to create custom measures like marketing ROI or lead-to-customer rate. Power Query is the tool used to clean and transform data before it becomes a dataset. We explain these terms in plain language and build reports your team can use without confusion.

Why Epik Funnel USA Creates Reports That Stay Clean, Accurate, and Easy to Maintain

Many reports look good in the beginning but fail later because data breaks, definitions change, or calculations are inconsistent. We prevent that by building a stable reporting foundation. We define metric rules clearly, use consistent naming, document key logic, and create a structure that supports future updates. Our goal is to keep your Power BI reporting useful for the long term. With Epik Funnel USA, you get dashboards that stay reliable even as your marketing channels grow and your tracking becomes more advanced.

Common Problems We Solve with Power BI Reports Services in USA and Better Analytics Structure

Most organizations do not have a data problem, they have a clarity problem. Data sits in multiple tools, metrics do not match, and the team cannot trust reports. We solve that by connecting sources, cleaning data, and building a single reporting view. We fix issues like mismatched lead counts, unclear attribution, missing funnel visibility, and lack of performance segmentation. We help you track what matters in digital marketing, including campaign performance, channel ROI, and lead quality trends, so decisions become faster and smarter.

  • Disconnected data across marketing platforms and CRMs
  • Conflicting metrics that cause confusion and bad decisions
  • No funnel visibility from click to lead to customer
  • Slow reporting that delays weekly and monthly decisions
  • Hard-to-read dashboards that teams do not actually use

Reporting Services Your Team Needs and What We Include in Power BI Reports

We focus on reporting that supports digital marketing, online performance, and growth decisions. That includes marketing dashboards, lead reporting, conversion dashboards, paid media reporting, SEO performance dashboards, and multi-channel attribution views when data allows. We also build reporting for sales teams such as pipeline dashboards and lead quality analysis so marketing and sales can work from the same truth. We keep the experience easy to use so your team can find answers without spending hours in spreadsheets.

Data Integration and ETL Setup for Marketing Tools, CRMs, and Online Sales Systems

Great Power BI reporting depends on clean data flow. We connect your platforms and organize the data so it is usable. This may include connecting Google Analytics, Google Ads, Meta Ads, LinkedIn Ads, your CRM, and ecommerce data if needed. We also set up transformations using Power Query and build a structured data model so metrics calculate correctly. We take a practical approach that fits your current stack and the visibility your team needs.

We Build a Strong Data Model That Makes Metrics Consistent Across All Reports

Many Power BI dashboards fail because the data model is weak. We build models that support clean relationships, consistent date logic, and correct aggregation. This helps you avoid double counting, mismatched totals, and broken filters. We also define measure logic using DAX measures so your metrics stay consistent across every page. This creates reporting confidence and prevents the common problem of each department using different definitions for the same metric.

KPI Dashboards Built Around Marketing Metrics, Sales Outcomes, and Clear Growth Signals

We design dashboards that answer the questions your team actually asks. That includes performance by channel, performance by campaign, and performance by audience or region when data is available. We build clear KPIs for cost per lead, conversion rate, customer acquisition cost, and return on ad spend. We also support deeper views like lead-to-customer conversion and pipeline movement so you can see whether your marketing is driving quality, not only quantity.

Custom Calculations and DAX Measures That Match Your Business Definitions

Not every organization measures success the same way. We create custom measures that reflect your real goals. That might include unique definitions for qualified leads, sales accepted leads, pipeline value, or multi-touch performance. Using DAX calculations, we can build clear metrics like blended cost per lead, weighted pipeline value, and performance by marketing segment. We keep this logic documented and consistent so your team can trust the numbers and use the reports with confidence.

  • Custom KPI measures based on your goals and funnel stages
  • Time-based analysis for weekly, monthly, and quarterly reporting
  • Segment reporting by source, campaign, region, or product line
  • Quality indicators that connect leads to pipeline or revenue

Interactive Reports with Filters, Drill-Down Views, and Easy Exploration for Any Team

Power BI becomes most useful when reports are interactive and easy to explore. We build filters that make sense, drill-down views that answer follow-up questions, and simple navigation so users can find what they need. We also make reports responsive and readable so they work across devices. This helps teams in the USA act faster, because they can explore the data without needing a data analyst for every question.

Report Design That Improves Readability, Trust, and Adoption Across Your Organization

A report only matters if people use it. We design dashboards with clean layouts, clear labels, and logical grouping of metrics. We remove clutter and focus on clear trends. We also add context so the report teaches the user what the chart means. Good report design increases adoption and reduces the β€œwhat does this mean” problem that often blocks teams from using analytics.

Data Refresh, Automation, and Ongoing Reporting Support for Long-Term Reliability

We help your reporting stay up to date through refresh planning and automation support. Depending on your data sources, we can set schedules and build refresh-safe logic so reports remain consistent over time. We also help you update reporting as your tracking changes or as you add new marketing channels. The goal is to keep the reporting system stable so you can rely on it week after week.

Tools and Platforms We Use in Our Power BI Reports Services in USA

We use professional tools that support clean reporting, strong modeling, and practical integration. We select the right approach based on your current stack and what your team needs to see. We also make the experience understandable so stakeholders can read reports without needing technical help.

Tools Purpose
Power BI Desktop, Power BI Service Build and publish reports, manage dashboards, and share insights across teams
Power Query, DAX Clean data and build custom measures that match your metric definitions
Connectors for analytics and ad platforms Pull data from web analytics, ad platforms, and CRMs for unified reporting
Data gateways and refresh planning Support stable refresh and reliable reporting automation

If you want reporting that is easier to understand and easier to trust, we can review your current dashboards and create a plan for cleaner Power BI reporting and clearer marketing analytics.

Benefits and Value You Gain from Clear Power BI Dashboards and Better Reporting Discipline

You gain clarity, faster decisions, and a shared view of performance across teams. You reduce time spent pulling data and arguing about metrics. You can spot trends earlier and take action sooner. Over time, better reporting helps you improve marketing efficiency, optimize budgets, and connect activity to outcomes. We do not promise specific results because your data, strategy, and market conditions vary, but we build reporting that supports better decisions and better growth control.

Standards We Follow to Keep Reports Accurate, Trustworthy, and Useful for Leadership

We follow consistent reporting practices so dashboards stay clean. We define metric rules, document key measures, and build models that prevent errors. We also design reports with clarity and avoid visual clutter. Our goal is to create reporting that leadership can trust and teams can use, with clear definitions and stable logic.

Why Epik Funnel USA Can Build Reporting That Supports Digital Marketing and Online Growth

Our team combines data analysis, marketing performance expertise, and practical report design. We understand digital marketing metrics and we know how to build dashboards that connect activity to outcomes. We also explain reports in plain language so your team can use them daily. With Epik Funnel USA, you get a reporting partner that focuses on clarity, consistency, and usability for teams across the USA.

Book a Reporting Review Call with Epik Funnel USA

If you want us to review your current reporting and recommend improvements, you can schedule a time. We will focus on dashboard clarity, data accuracy, and the reporting structure needed for better marketing decisions.

Follow Epik Funnel USA for Reporting Tips, Analytics Clarity, and Dashboard Ideas

Stay connected for practical insights about marketing dashboards, Power BI reporting, and performance tracking. We share simple ways to improve reporting clarity and help teams make better decisions.

Frequently Asked Questions

Have questions about Power BI Reports Services in the USA? Here are answers to common queries for businesses seeking data-driven insights and reporting solutions.

What is Power BI and why should my business use it?

Power BI is a business analytics service by Microsoft that transforms data into interactive dashboards and reports. It helps businesses gain insights, make informed decisions, and visualize key metrics in real time.

How long does it take to implement Power BI reports?

Implementation depends on data complexity and reporting requirements. Basic dashboards can be delivered in 1-2 weeks, while advanced enterprise-level reports typically take 4-6 weeks or more.

Can Power BI integrate with our existing systems?

Yes, Power BI can connect to a wide range of data sources including SQL databases, Excel, SharePoint, cloud services, and APIs, ensuring seamless integration with your current infrastructure.

Do you provide custom Power BI dashboards?

Yes, we design fully customized dashboards tailored to your business needs, highlighting the most relevant KPIs, trends, and insights to support data-driven decision making.

Can Power BI reports work for small businesses?

Absolutely. Power BI is scalable and can deliver meaningful insights for small businesses with limited data, providing cost-effective reporting and analytics solutions.

How do you measure the effectiveness of Power BI reports?

We measure effectiveness by tracking user engagement, report adoption, accuracy of insights, and improvements in business decision-making supported by the data visualizations.

Do you provide Power BI training for employees?

Yes, we offer tailored training sessions to ensure your team can efficiently interact with reports, understand metrics, and leverage Power BI for decision-making.

Which industries benefit most from Power BI reports?

Industries such as finance, healthcare, retail, manufacturing, and technology benefit greatly due to the ability to visualize complex data, track KPIs, and optimize operational efficiency.

Can you optimize existing Power BI reports?

Yes, we review current reports for performance, visualization clarity, and actionable insights, enhancing dashboards to provide faster and more accurate decision support.

How do I get started with your Power BI services?

Simply contact us to schedule a consultation. We’ll assess your data and reporting needs and propose a customized Power BI solution that fits your business goals and budget.

Do you provide real-time data reporting in Power BI?

Yes, Power BI can provide real-time dashboards by connecting to live data sources, allowing your business to make timely, informed decisions.

Can Power BI reports be shared securely across teams?

Yes, we configure secure access with role-based permissions, ensuring team members can view or edit reports based on their authorization levels.

How do you ensure data accuracy in Power BI reports?

We implement proper ETL processes, validate data sources, and apply rigorous testing to guarantee reports accurately reflect underlying business data.

Can Power BI improve business insights and decision-making?

Yes, Power BI provides interactive visualizations and data exploration tools that reveal trends, outliers, and opportunities, empowering smarter business decisions.

What reporting tools do you use alongside Power BI?

We use SQL Server, Azure Data Services, Excel, and other BI tools to complement Power BI, ensuring seamless integration and comprehensive reporting solutions.

How do you manage client communication and updates for Power BI projects?

Clients receive regular progress updates, dashboards previews, and have direct access to their project manager for questions and feedback throughout the reporting development cycle.

Do you provide testing and validation for Power BI dashboards?

Yes, we conduct thorough testing for accuracy, responsiveness, and usability to ensure dashboards meet business requirements and provide actionable insights.

Can you create interactive and mobile-friendly Power BI reports?

Yes, we design interactive dashboards optimized for desktop, tablet, and mobile devices, ensuring seamless access and usability for all users.

What is a Power BI audit and why is it necessary?

A Power BI audit reviews your existing reports, data sources, and dashboards to identify gaps, inefficiencies, and opportunities for optimization and improved decision-making.

How do you stay updated with the latest Power BI features and best practices?

Our team regularly participates in Microsoft Power BI training, webinars, and community events to leverage the latest features, updates, and best practices for our clients.

We are in 1 Minute Thirty Seconds

Discover the comprehensive range of digital marketing solutions we offer, designed to drive growth, engagement, and measurable results for your business.

Get in Touch with Us

We’d love to hear from you! Fill out the form below and we’ll get back to you shortly.

What Our Clients Say

Our success is built on the trust and satisfaction of our clients. Read firsthand accounts of how Epik Funnel has helped businesses like yours thrive.

4.9 / 5.0 Stars

“Working with Epik Funnel was a game-changer for our business. Their strategies are precise, their execution is flawless, and the results speak for themselves. Truly exceptional!”

Alex Johnson

CEO, Global Solutions Co.

Based on hundreds of verified reviews across multiple platforms.Based on hundreds of verified reviews across multiple platforms.Based on hundreds of verified reviews across multiple platforms.Based on hundreds of verified reviews across multiple platforms.Based on hundreds of verified reviews across multiple platforms.Based on hundreds of verified reviews across multiple platforms.Based on hundreds of verified reviews across multiple platforms.Based on hundreds of verified reviews across multiple platforms.Based on hundreds of verified reviews across multiple platforms.

Read More Reviews On:

Recent Google Business Reviews

Aisha K.

“Epik Funnel’s local SEO expertise is unmatched! My business has seen a massive increase in local leads.”

Usman T.

“The social media team is brilliant. Our engagement rates soared, and their content truly resonated with our audience.”

Fatima R.

“Finally, an agency that delivers! Their PPC campaigns brought in high-quality leads consistently. Excellent reporting too.”

Ali H.

“Professional and efficient. The website redesign was seamless, and the new UX is fantastic. Very happy with the outcome.”

Explore Related Services